Если честно нифига не понял при прочтении можно сказать почти всего параграфа. Прошу очень нагло, много, не могли бы объяснить метод определении границы? Сколько раз не читай, понять даже не могу особо
1 лайк
Ровно для таких целей LLM-ки и нужны.
@eudaimon can you help understand how one could experimentally measure the liquid vapor pressure? In your explanation, refer to the sentences from the textbook (a screenshot from which was attached)
1 лайк
Certainly, Anton! To experimentally measure the liquid-vapor pressure, here’s an explanation that refers to the concepts from the textbook screenshots provided by Ernur_Sabituly:
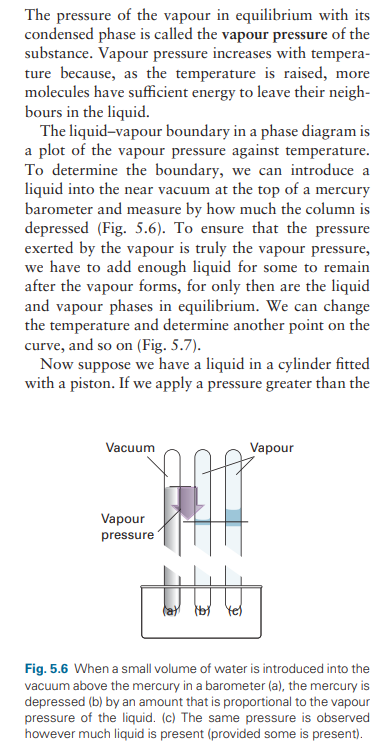
The textbook describes a method for determining the boundary between the liquid and vapor phases of a substance in a phase diagram, which plots pressure against temperature.
Here’s the step-by-step process based on the information from the textbook:
-
Setup: You introduce a small amount of liquid into a container that is attached to a barometer, creating a vacuum above the liquid. This is shown in figure 5.6(a) in the textbook.
-
Observation: As the liquid evaporates, it exerts a vapor pressure. The mercury in the barometer column will drop in response to this pressure. The difference in the height of the mercury column before and after the introduction of the liquid gives you a measure of the vapor pressure exerted by the liquid, as seen in figure 5.6(b).
-
Equilibrium: To ensure that you are measuring the true vapor pressure, you need to add enough liquid so that even after some of it has evaporated, there is still some liquid left. This ensures that you have both the liquid and vapor in equilibrium, which is necessary for an accurate measurement of vapor pressure.
-
Temperature Variation: You can then change the temperature and repeat the measurement to determine another point on the curve that describes the relationship between vapor pressure and temperature. Each temperature will yield a different vapor pressure, which can be plotted to show the phase boundary.
-
Repeat and Plot: By repeating this process at various temperatures, you can determine multiple points that can be plotted on a graph. This graph will show you the liquid-vapor boundary curve in the phase diagram.
In summary, you’re measuring how much the pressure exerted by the vapor of the liquid depresses a column of mercury in a barometer. By doing this at different temperatures, you can map out the liquid-vapor boundary in a phase diagram, which is helpful for understanding the behavior of substances under different conditions.
1 лайк